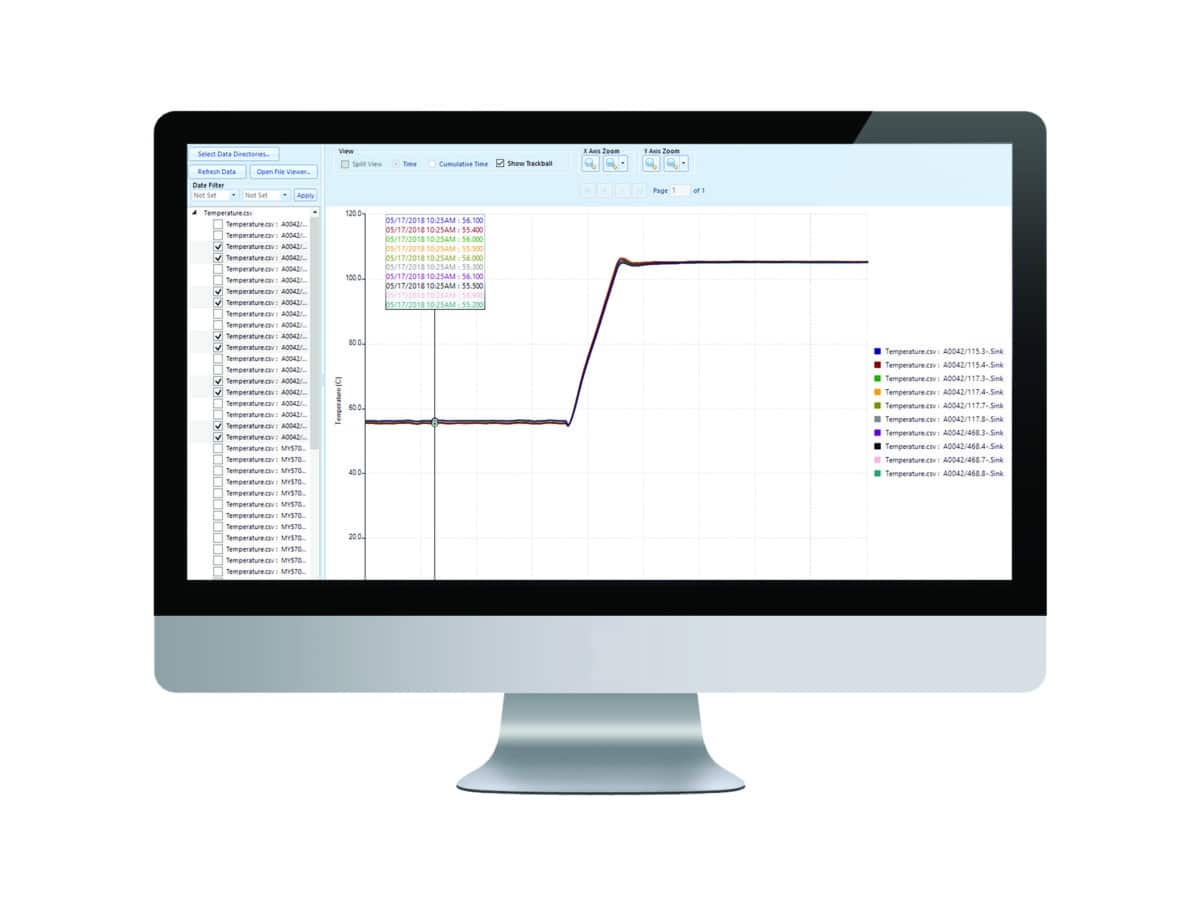
STARPLOT software application graphically presents a view of reliability data generated by STARS. STARPLOT provides a graphical view of reliability data where defects such as internal shorts in LED arrays, connector wear, and even thermal problems may be identified. Shown here is a STARPLOT view of a reliability test warm up; temperature versus time for a single reliability test.
STARPLOT software allows operators to verify ITCS temperature uniformity, ultimately leading to more repeatable, reliable test results.


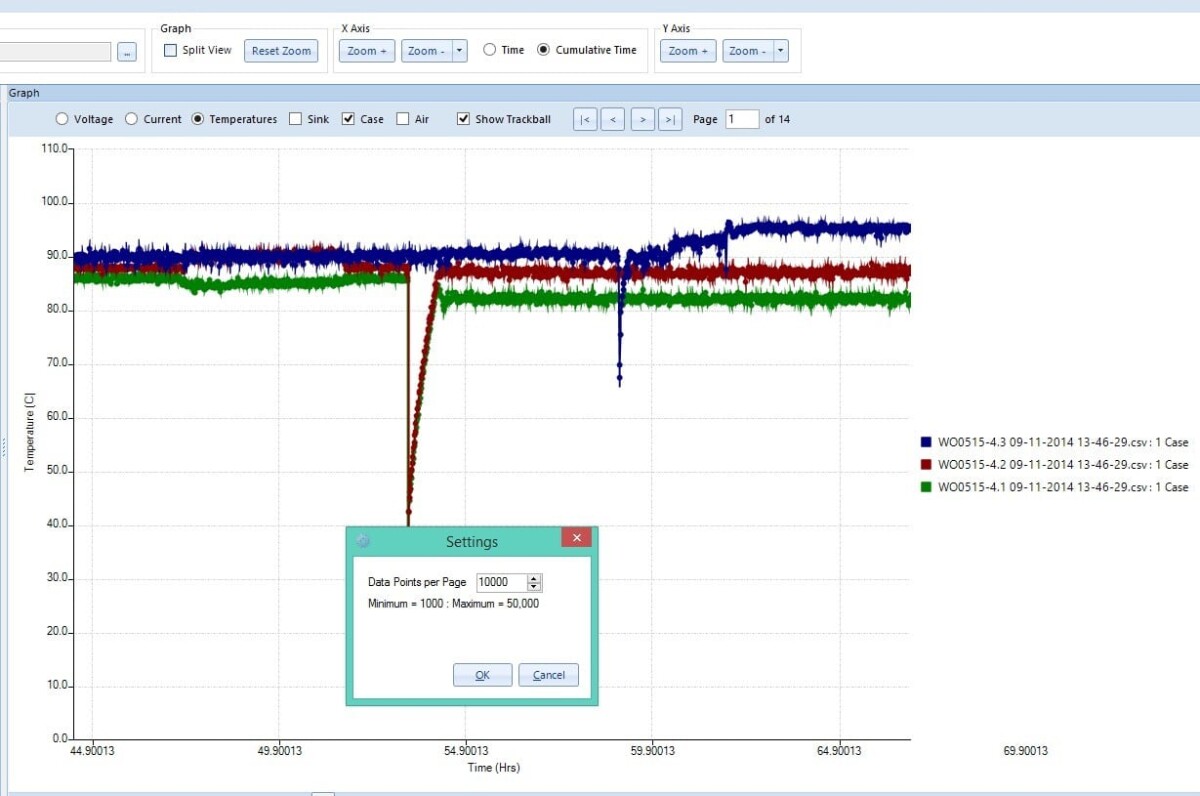
With STARPLOT, it is easy to see the big picture and visualize reliability trends. Zoom feature expands anomalies simplifying failure analysis. Highlighted here is a 3V Vf drop identifying a failure condition.
Highlighted here is a 3V Vf drop identifying a failure condition.
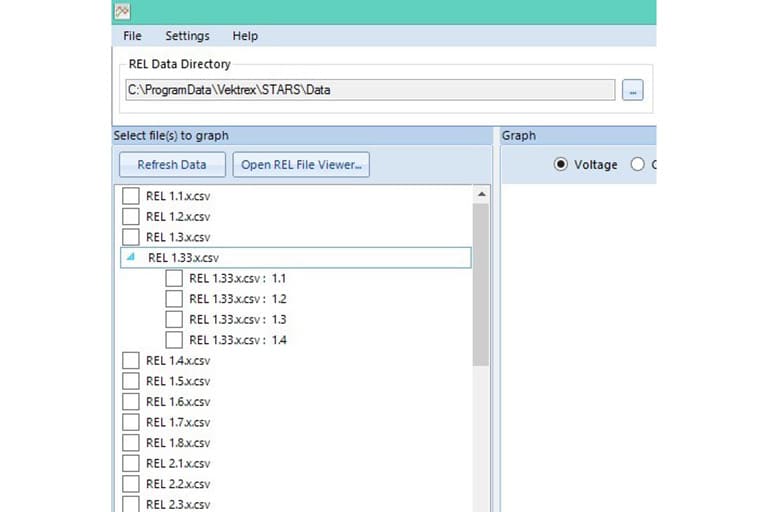
Select an individual reliability test to view or overlay multiple tests and compare reliability test data graphically. Note reliability data files and locations are user defined. Your test, your data, your location.
